How to Analyze Windows Minidump Files
Although minidump is often used, in reality, this refers to a Windows crash dump file. A crash dump file is created when Windows runs into a critical error and halts execution. A blue screen comes up in most cases that shows the stop error code and an error message. Solving a system crash means knowing how to analyze Windows minidump files. There are a few methods that you can use.
The Windows crash dump files can be minidump files (or small memory dump files) or full memory dump files. Which type is created can be configured. Depending on the type of memory dump file created, various tools are available to open the crash dump file and analyze it.
Using the Microsoft Dump Check Utility
The Microsoft Dump Check utility (or DumpChk.exe) is part of the Debugging Tools for Windows. Although the utility is part of the Windows Driver Kit (WDK) and the Software Development Kit (SDK), it is not necessary to install those completely. It is possible to only install the Debugging Tools for Windows. Here is how.
- Download the Windows SDK (use the Download the installer option, not the .iso option).
- Execute the downloaded SDK setup program (winsdksetup.exe).
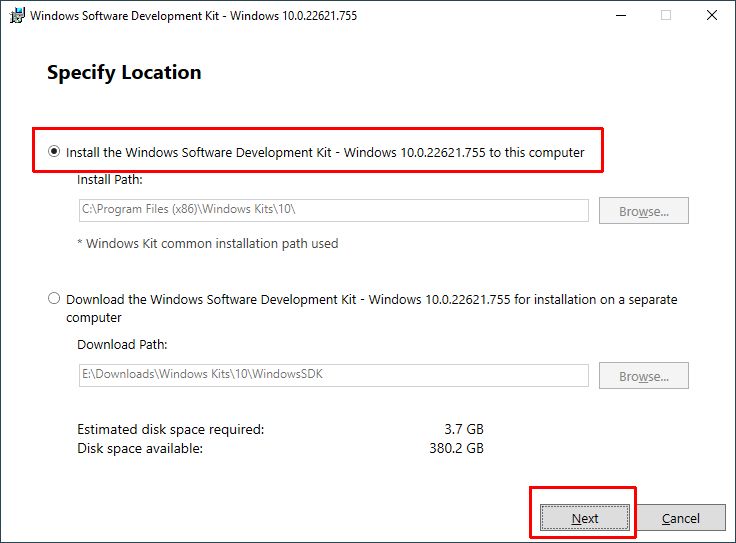
- Select the default option to install the SDK on the computer the installer is being executed on.

- Click Next.
- Select the Windows Kit Privacy option and click Next.
- Accept the License Agreement.
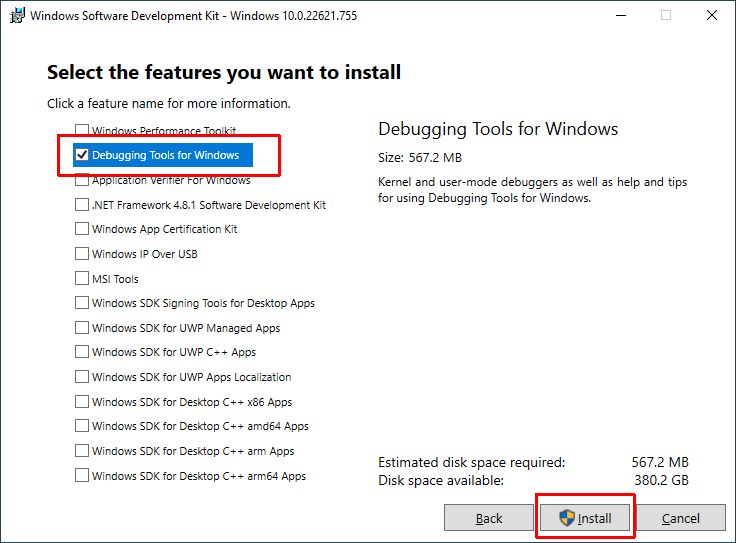
- Now deselect all options except for the Debugging Tools for Windows and click Install.

- Now wait for the installation of the SDK to complete and click the Close button to finish the installation.
After this, the DumpChk utility is available from the command prompt. Simply open a command prompt and execute the command dumpchk.exe <minidump file>
If the path to the dumpchk utility is not found, include it in the command, or make that folder the current folder. That is what is done in the example below. The parameter to the minidump includes the full path to the actual minidump.
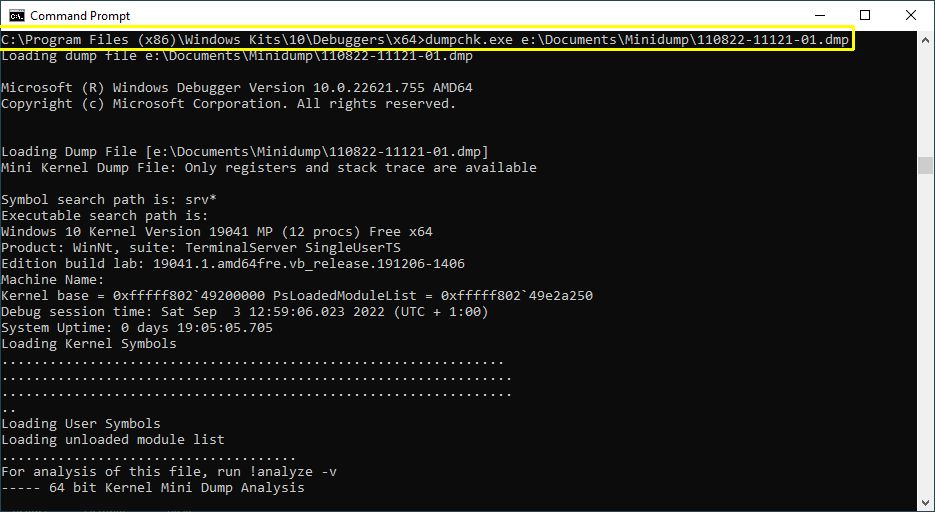
After pressing the Enter key, the utility will analyze the minidump file and show the results on the screen.
Wait for the command to finish, which will be visible from the text “Finished dump check” being shown and the command prompt returning.
You can now check the output of the command by scrolling back up to see the stop code details and the driver names.
Tip: to save the output of the DumpChk command to a text file, simply redirect the output using the > symbol. E.g. “c:\Program Files (x86)\Windows Kits\10\Debuggers\x64\dumpchk.exe" minidump.dmp > dumpoutput.txt“
After this, you can use a text editor to view and analyze the minidump output from the DumpChk command instead of scrolling in the command prompt window.
Using the Windows Debugger to Analyze Windows Minidump Files
To Windows debugger is also part of the Windows Debugging Tools for Windows. So, follow the steps in Microsoft Dump Check Utility to install that part of the SDK.
Use the WinDbgPreview App
An alternative way is to use the WinDbg Preview app from the Microsoft App Store. Visit the Microsoft download page and click the Get in Store app button.
After installing the Windows Debugger, you can analyze the minidump files with the WinDbg Preview app.
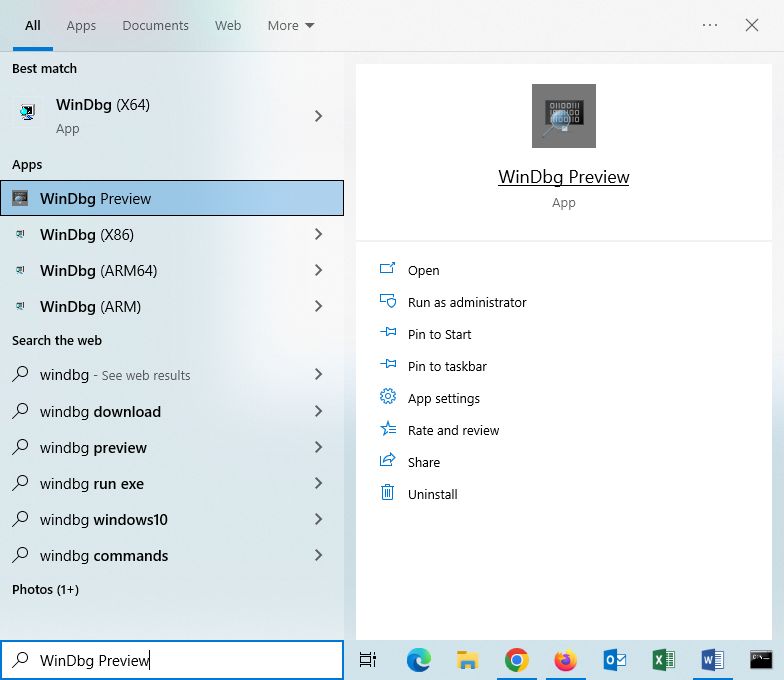
- Search for “windbg” in the Start menu search, and click the WinDbg Preview App.

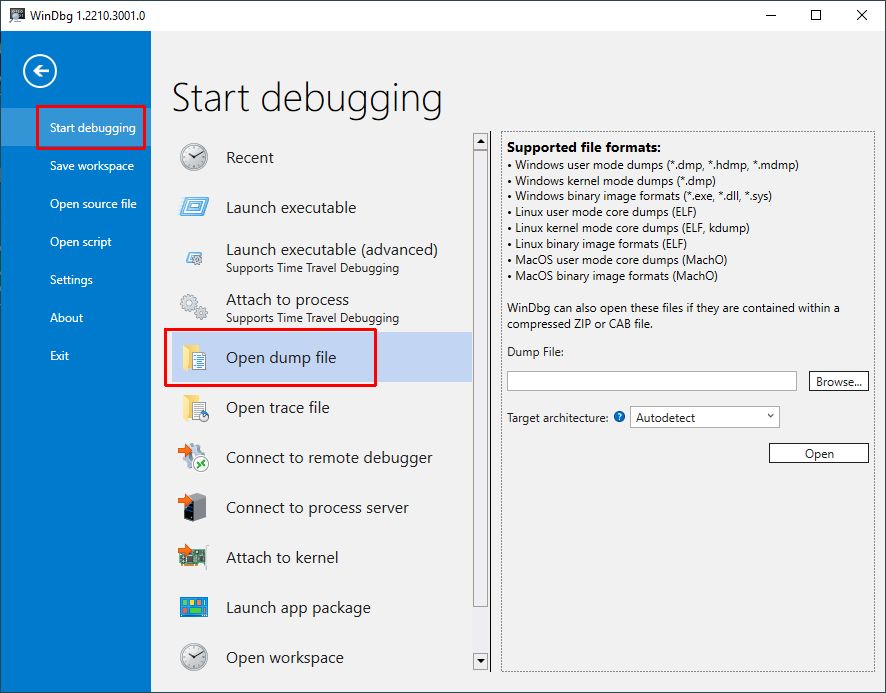
- In the WinDbg app window, click the File menu.
- Make sure Start debugging is selected in the left-hand pane.
- Click the Open dump file option.

- Next, click the Browse button in the right-hand pane.
- Navigate to and select the minidump file and click Open.
- In the WinDbg window, click the Open button to load the minidump file into the debugger.
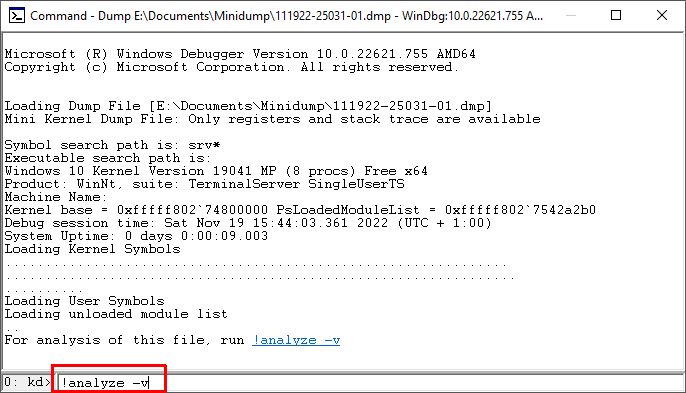
- Once the file is loaded and processed, type “
!analyze -v” to let WinDbg analyze the contents of the minidump.
The cursor will show BUSY and the BugCheck Analysis is executed. Once complete, you can scroll through and review the output to find the cause of the problem.
The output will include the stop error (text and code), exception details, and module and image name, all of which are useful to find the offending module (very often a driver).
Use the WinDbg executable from the SDK
If you installed the debugging tools using the SDK installer, running the WinDbg is almost the same but it looks a little different.
- Search for “windbg” in the Start menu search, and click the “WinDbg (x64)” option. Or “(WinDbg (x86)” for 32-bit systems.
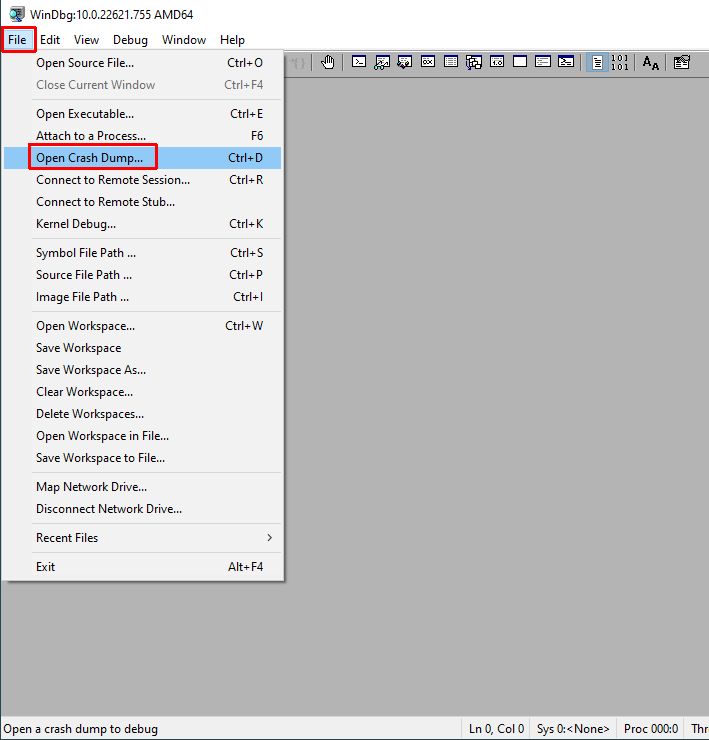
- In the WinDbg program window, select File and then click Open Crash Dump.

- Navigate to and select the minidump file and click Open.
- Once the file is loaded, again type the “
!analyze -v” command followed by the Enter key to run the bugcheck analysis.
- The output is the same as in the WinDbg Preview App.
For more details on how to use the Windows debugger, also check the command reference. The debugger can be a great tool for finding the cause of blue screen errors, but using it can get technical and complicated fast. A first step beyond the basic usage is to use the symbol files as they help make the output easier to read.
Using BlueScreenView to Analyze Windows Minidump Files
The BlueScreenView program is a third-party application that can be downloaded from the NirSoft website. You can download it as a ZIP file or as an installer. If you choose the installer, make sure to pick the right version (32-bit or 64-bit). Even though the program is a little older (last updated in 2015), it can still be very useful to quickly check the details of a minidump.
The program hardly takes any space on disk, which cannot be said for the Microsoft SDK tools. And since it is freeware, there is no reason not to give it a try.
When the program is executed, it will automatically load and show the details of the minidumps present on the system. If you do not see anything, there either are no minidump files available, or a different path is used.
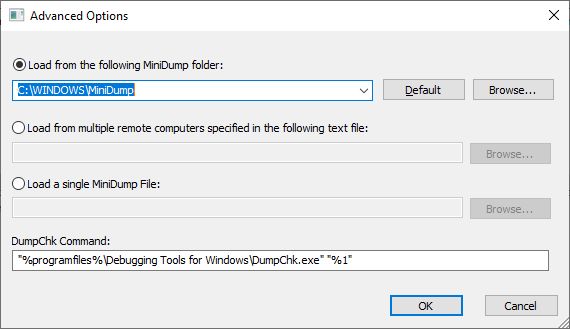
To specify the location of the minidump files on the system, use the Options menu and select Advanced Options. In the window that comes up, the folder for the minidumps can be selected.
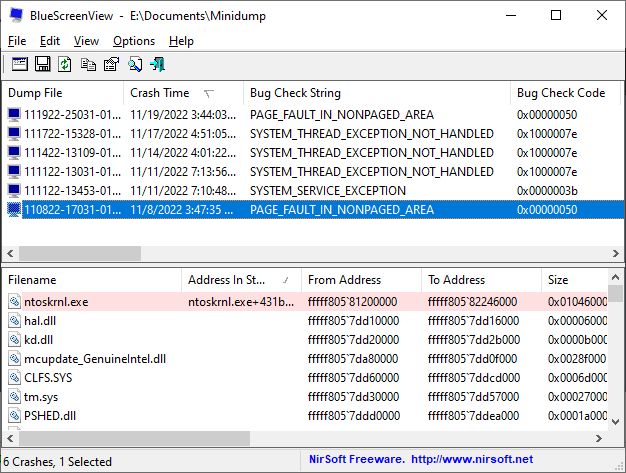
For each minidump file, the program shows the details related to the computer status. This includes the drivers that were loaded during the crash.
More details can be found on the program website. There are details on usage as well as interpretation of the information shown in the program.


This can be addressed using LongPathTool.
I would like to download windows vista
You can use Long Path Tool to fix this problem. Here's how it helps: Finds files/folders with too-long paths. Moves,…
Thank you. It works.
@Fritz Liessling - Thank you for your feedback. I understand that you are looking for other resolutions, but within Windows…